Projects
Tracking Skin Changes Over Time
Computer Vision | ML | Skin Cancer
One of the most common signs of skin cancer is changes on your skin in the form of new growths or changes to existing moles. Thus it is important to be able to effectively monitor and track skin lesions over time.
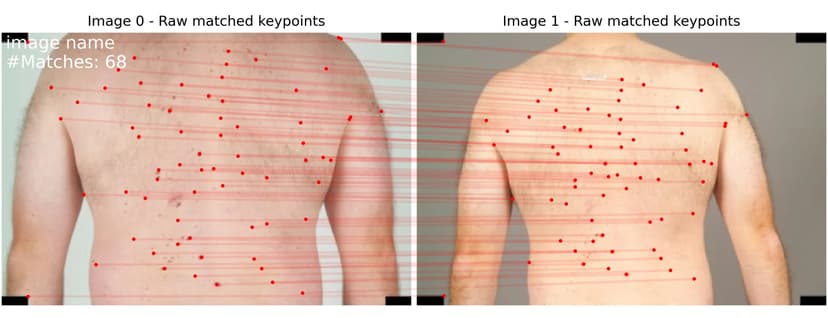
Image matching is a core computer vision problem with applications in domains like scene reconstruction, AR/VR, SLAM, etc.
Tracking skin lesions over time can be structured as an image matching problem, leveraging state of the art advancements in image matching approaches, specifically using deep neural networks like CNNs and Transformers to identify and match keypoints across images.
Matching techniques like SuperGlue, OpenGlue, and LightGlue utilize sparse keypoints to identify matches across images while approaches like LoFTR, DKM, and RoMa perform dense matching (considering all image pixels).
This example above shows the effectiveness using sparse keypoint detection and matching to identify the same skin lesions over time. Combining these techniques with a larger pipeline to localize and measure skin lesions allows for a fully automated approach to identify new or changing skin lesions. You can learn more about the larger system developed at SkinIO for skin abnormality monitoring here and here.
Example images from ISIC Archive. Image matching using LightGlue (code).
Detecting 'Ugly Duckling' Skin Lesions
Computer Vision | ML | Skin Cancer
The 'Ugly Duckling Sign' is a common method used by dermatologists to identify moles that stand out or look different from surrounding moles. Since most moles on your body are visually similar to one another, this can be an effective approach to help identify potentially cancerous lesions.
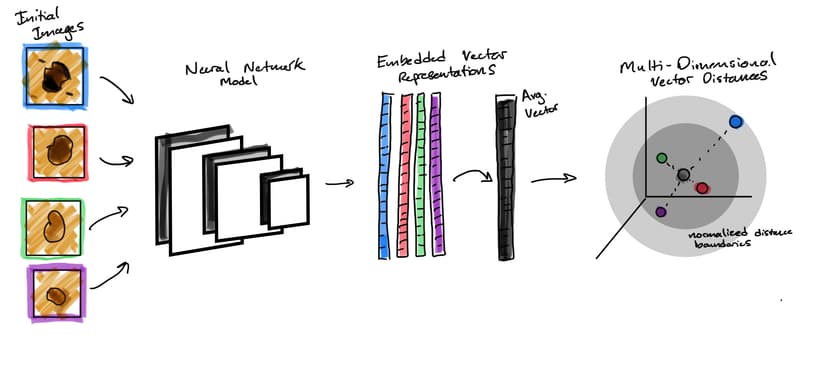
At SkinIO, I developed a approach to automate this type of outlier detection to assist dermatologists in identifying suspicious lesions.
The patented approach utilizes a deep neural network to first create a vector embedding for each identified lesion on a person's body, calculates the average of these vectors, and finally calculates a distance metric used to rank and identify lesions that significantly differ from the average.
At SkinIO, this technology is integrated within our mobile application enabling us to calculate and visualize these outlier lesions in real-time as a set of images are captured, allowing the technology to be deployed within the typical in-office visit or teledermatology screening. The outlier detection technology was deployed in a partnership with Stanford University to assist in screening patients in a senior living community article.
To learn more about this type of approach to identifying concerning outlier lesions, I recommend reading the excellent research from Soenksen et al (pdf available here) developing a similar process.
SmartChart - Automatic Charts and Insights from CSV data
GenAI
GitHub (opens in a new tab)Demo (opens in a new tab)SmartChart is a proof-of-concept application to help non-experts turn raw spreadsheet data into actionable insights and supporting visualizations.
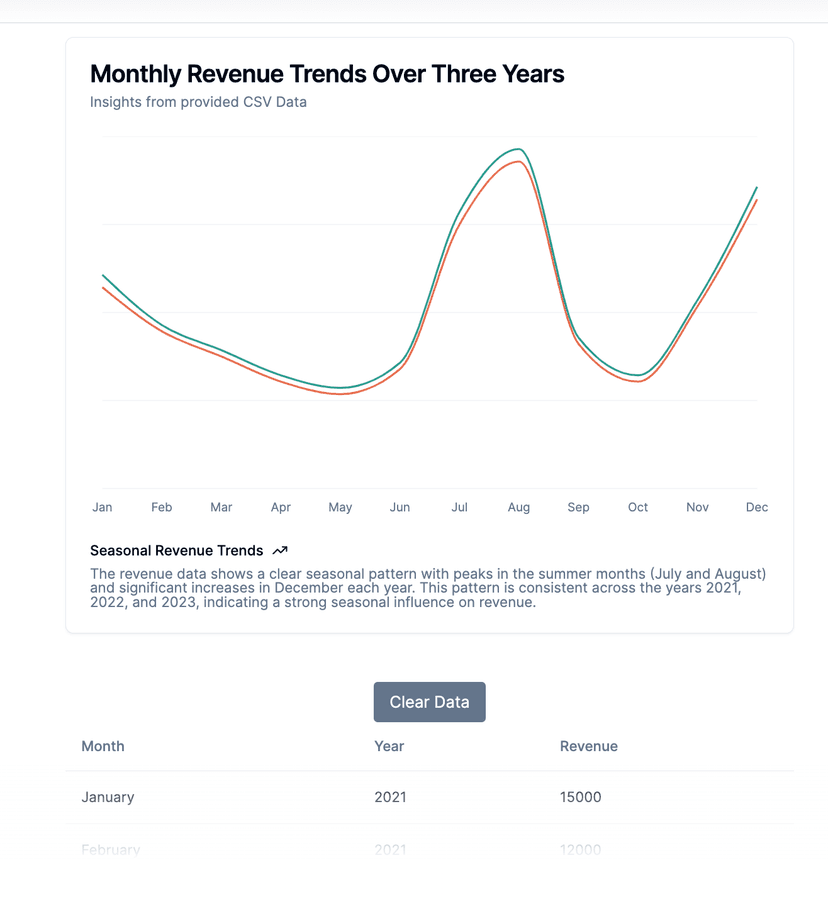
SmartChart allows users to import a CSV or Excel file and let the AI-powered backend analysis do the heavy lifting. The tool heavily depends on structured output feature recently supported by OpenAI/Google Gemini to generate useful charts and visualizations to help users spot trends, identify patterns, and make informed decisions.
The app is currently built using Next.js, OpenAI API, and deployed on Vercel. Additionally, Shadcn/ui is used for easy, clean UI components.
Instant ETL for spreadsheets and easily create/edit metrics
GenAI
GitHub (opens in a new tab)Demo (opens in a new tab)Kind of a sibling project to SmartChart, Easy ETL is another gen-AI powered tool that attempts to extract and transform user provided data in an automated + repeatable way.
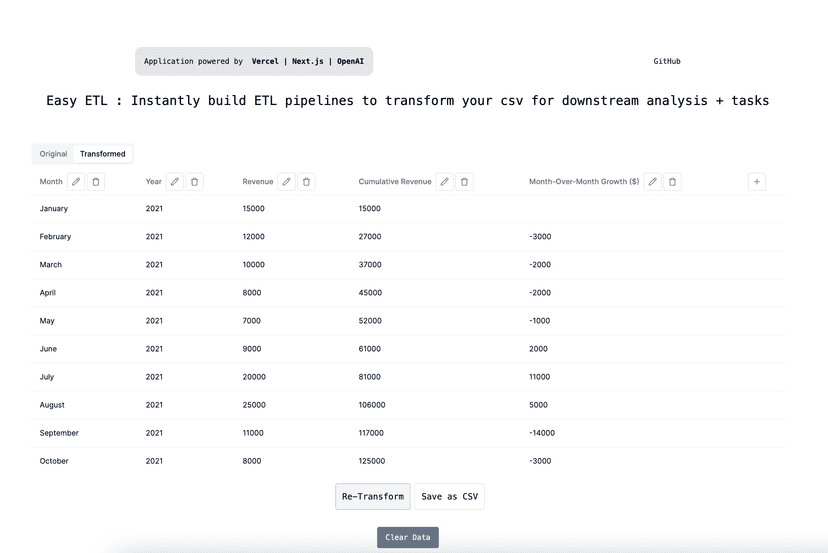
After the model (currently using Llama-3.1 hosted on Groq) provides an initial transformation, the user is able to review (edit, remove, add) the proposed columns and iteratively refine the transformation until the output is in the desired format.
Future work will allow for saving and loading transformations and integrating with SmartChart tool to allow full data processing -> analysis -> visualization pipelines to be saved and shared.
Structured Image Descriptors Using Multi-Modal models
GenAI | Computer Vision
GitHub (opens in a new tab)Demo (opens in a new tab)Seriously, another little web app using structured output...
Errrrr.. Yes.

SceneScribe is a demo app that can assign 'tags' to describe the data sample using a consistent schema. Using multi-modal gen-AI models like GPT-4o from OpenAI, SceneScribe is able to generate tags for a provided image including descriptors for image content, quality, and composition.
Disc Analyzer - Fast, standardized product photography and analysis
Computer Vision | ML
Website (opens in a new tab)Disc Analyzer is a tool to help disc golf retailers capture fast, high-quality photos for their e-commerce stores. It utilizes specialized computer vision models to help vendors quickly and easily capture and process the photos needed for their products.
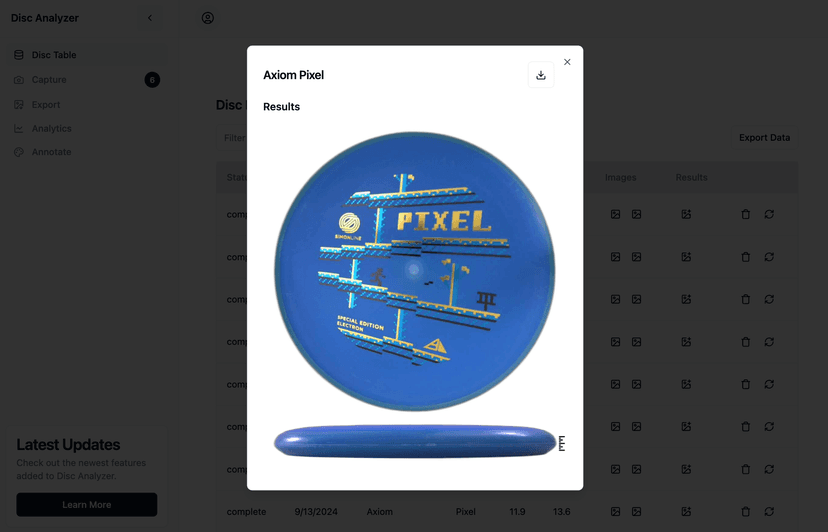
The disc analyzer web app allows users to simultaneously capture multiple images of a disc that are then merged in to a final photo for the disc's product page.
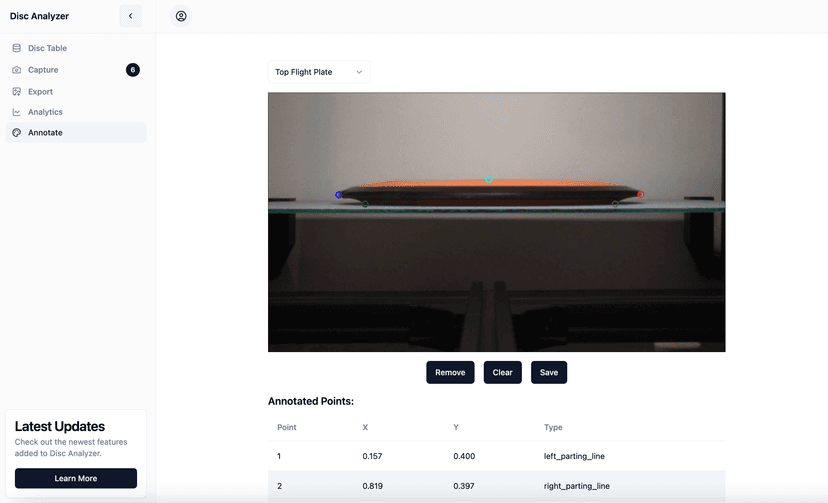
The image processing is powered by a custom image segmentation model based on BiRefNet and hosted on Modal for serverless GPU compute. The web application includes a specialized annotation tooling that allows users to correct/refine disc masks to be included in future, automated modal training runs.
Neural Correlates of Attention and Decision Making
Neuroscience | Computer Vision
Paper (opens in a new tab)At any given moment, activity within our brain is constantly changing. However these changes are not random, but structured with certain spatial and temporal dynamics.
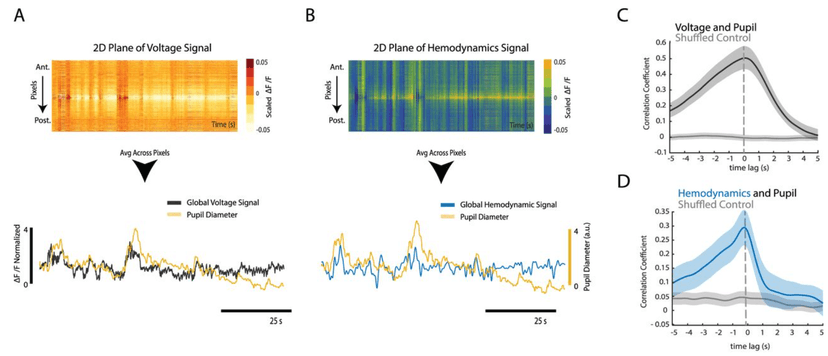
For one of my thesis projects, I investigated how these brain dynamics were related to changes in attention: simultaneously recording fluorescent changes in the mouse cortex as an approximate measure of voltage and the mouse pupil which has been shown to fluctuate with changes in attention and arousal.
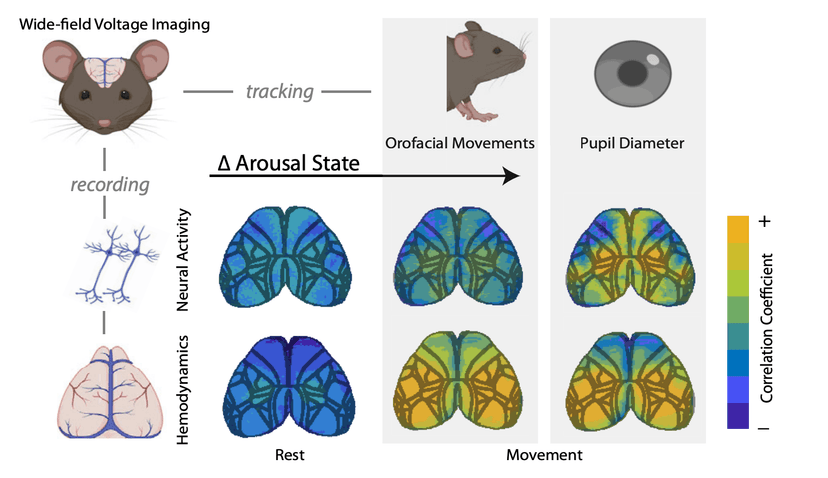
Our results demonstrate that changes in pupil diameter are able to account for up to 70% of the variance in the brain activity, demonstrating just how important arousal and attention changes are in influencing ongoing brain activity.
Basal Ganglia Control of Directional Movements
Neuroscience
Paper (opens in a new tab)How our brains control the preparation and initiaion of movements remains poorly understood.
One of my PhD projects aimed to provide the first evidence of fast reversible manipulations of basal ganglia output directly influencing motor responses. This was also the first study to begin to isolate the effects of basal ganglia output specifically to the motor thalamus on the control of motor behavior.
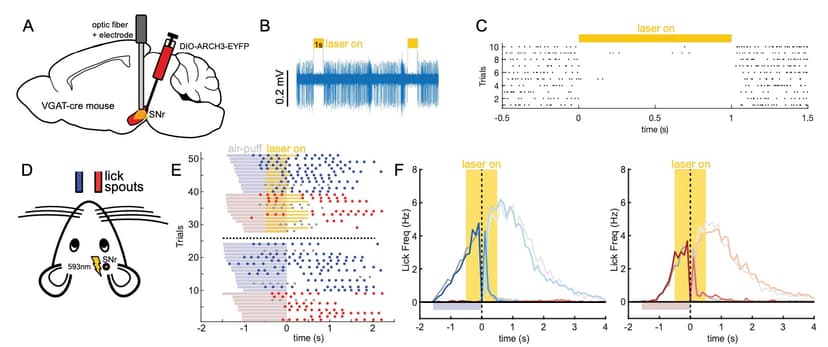
I found that inhibiting the SNr directly led to a contralateral bias in the licking motor response and that direct activation of the SNr suppressed licking activity altogether.
Interestingly, selectively inhibiting the SNr projection to the BGMT biased licking responses to the ipsilateral direction. These observations broadly support classic BG models and further suggests that ascending basal ganglia output to the thalamus and cortex helps to shape the preparation and initiation of sensory guided movement.